Technical Analysis in Forex Trading

To become a professional Forex trader, you should learn about technical analysis and how to use it in your trading practice. By applying various technical tools, Forex traders can explore the charts of currency pairs in detail and determine the best trading options for performing currency trades. This paper explores the primary technical analysis tools, illustrating their importance in trading.
What is technical analysis in Forex?
The technical analysis encompasses various tools and actions traders use to predict the behavior of the market based on previous market data.
In Forex, technical analysis is a concept of the Forex market evaluation based on historical changes. The technical analysis seeks to help technical analysts and traders determine the next direction of currency pairs’ prices. The analysts believe the market is cyclical, and its behavior is foreseeable.
Unlike fundamental analysts who study financial and business news, rumors, the corporate performance of companies, and political factors, technical analysts explore previous trading data. Such technical trading involves learning diagonal and horizontal lines to identify support and resistance levels. Proponents of technical analysis rely on Forex charts, patterns, and indicators.
How to use technical analysis in Forex?
Combining technical and fundamental analysis is the best way to learn about the market for trading. While examining such statistical data as changes in rates and inflation, the geopolitical situation, and other economic and financial factors affecting currency exchange rates, it is also important to apply technical tools to determine the Forex market's future movements and benefit from it.
Let’s discuss the main tools of technical analysis that help Forex traders to make a detailed chart examination of currency pairs for the best trading opportunities.

Support and resistance levels as a basic technical analysis tool
When you start using technical analysis in Forex, you’d better first learn about support and resistance levels. These levels show where the price stops moving in one direction and reverses, helping you understand the market trends and trade signals and grounding your future strategy.
Support
Support is the price level at which a downtrend stops with a high probability due to the demand concentration. When the decreasing price bumps into the support on the chart, it is highly likely to rebound in the bullish direction.
For example, you make a short trade in the EURUSD currency pair, and the pair decreases in your favor. Eventually, it reaches the support level already tested and held before. At this point, it would be an excellent chance to close the trade expecting the reversal from the lowest.
Resistance
Resistance, in turn, is the price level at which growth most likely stops due to the concentration of supply. When the price moves upwards and meets a hesitating point, it discovers resistance and will probably bounce off in the bearish direction.
For example, you are on a long trade in the USDCAD where the price is consistently rising. Then, you notice that the price movement stops at a particular level of resistance – a great opportunity to exit the trade and remain positive.
Trend lines
The trendlines are an essential tool for technical analysis. In charts, the trendline is an imaginary straight diagonal line that goes upwards or down along price movements, connecting lows and highs of the price action. The trendlines illustrate the prevailing movement of prices in one direction, called a trend. There are different trendlines you can use in Forex.
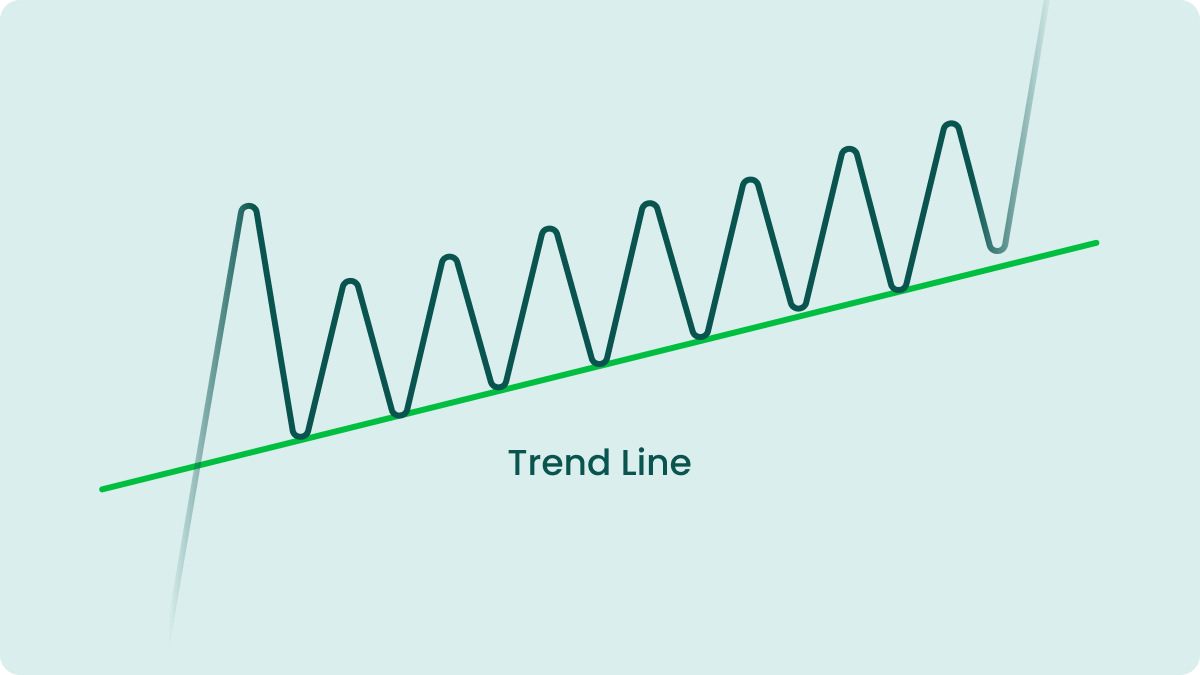
Bullish trend line
The bullish trend line is a straight line that moves upwards and connects the lows of sloping candles during an uptrend. The bullish line limits the uptrend from below and acts as a support for the price movements. It goes upwards while the inclination angle varies depending on the trend's strength – the sharper it is, the less pronounced the trend.
The bullish market is a great opportunity for long trades. You can buy a currency pair expecting the price most likely to rise, and eventually, you will be in a profitable position.
The end of the uptrend happens after the price breaks under the bullish trendline and begins to decline – the bearish breakdown.
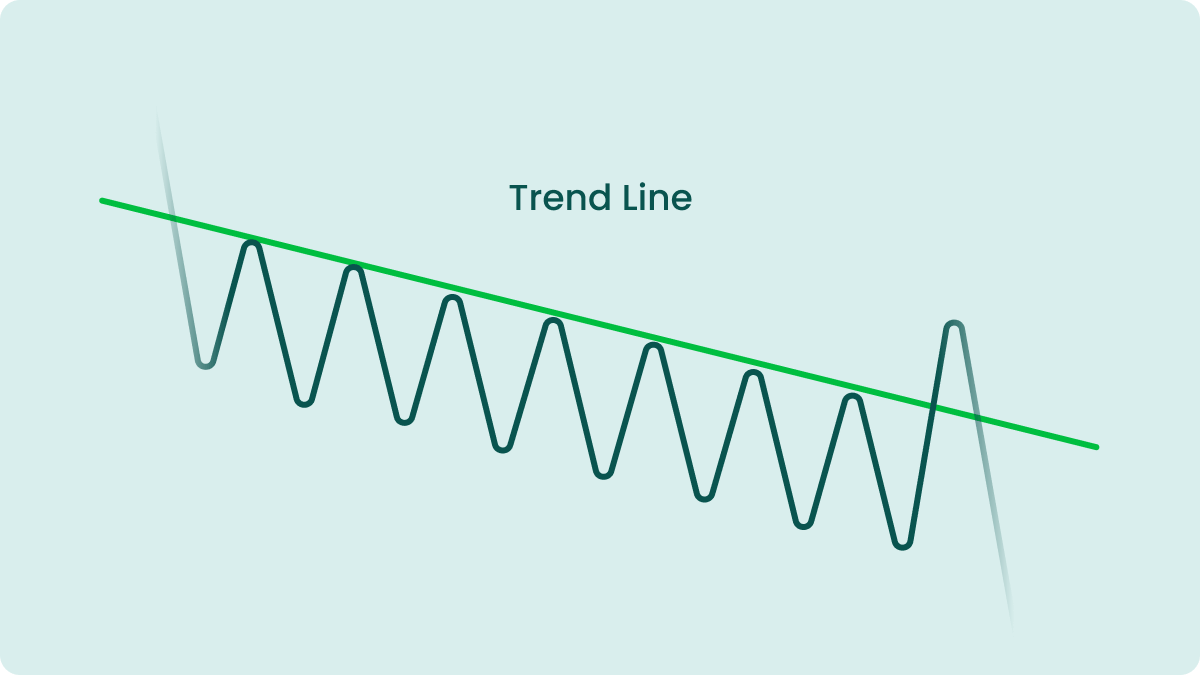
Bearish trend line
The bearish trend line is the straight line opposite the bullish one and acts as resistance. The bearish lines illustrate the price movements during a downtrend. They are drawn above the price's candlesticks and start by the first candle of upward momentum, which is passed by another candle, demonstrating a shift towards lower prices.
The bearish trend shows the pessimistic sentiment of the market on the future of the currency pair when traders start to sell the currency to profit from the price decline.
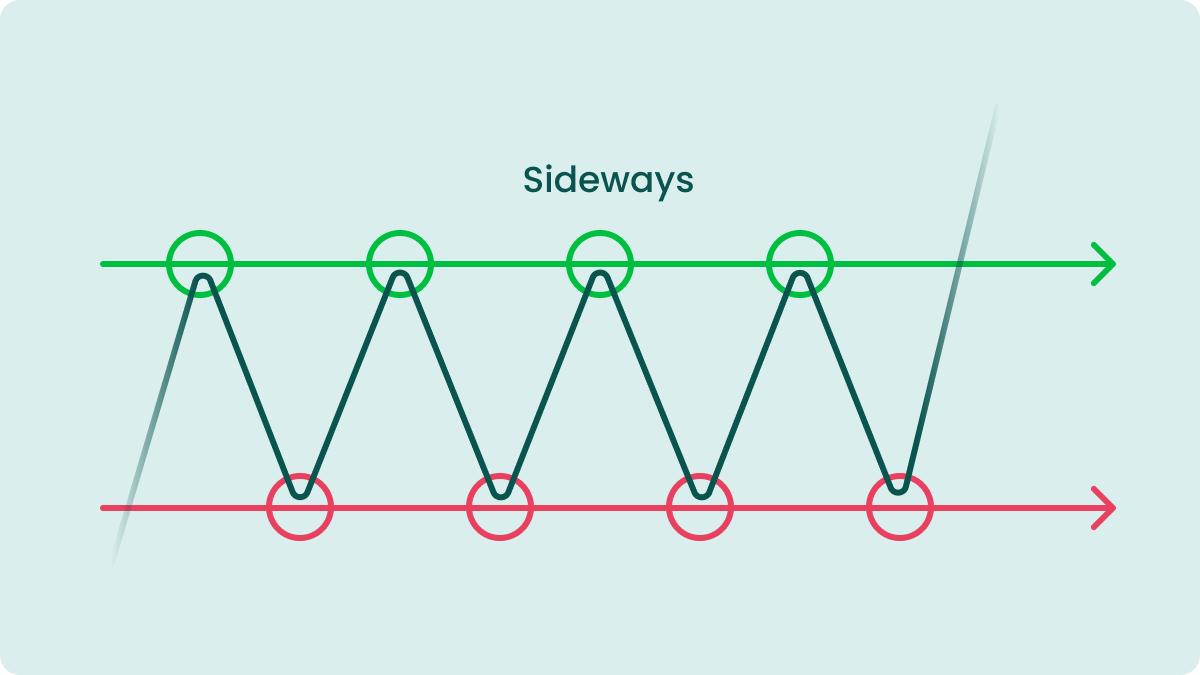
Sideways trend
The third type of trend line occurs when the supply and demand are almost equal. The sideways trend shows the absence of pronounced unidirectional movement.
Many Forex traders call a sideways trend a flat. There is a so-called silence in the market when many traders prefer to wait for a specific price movement. This natural market state disappoints trend traders. However, you can meet some professionals who use flats in their favor applying scalping strategies. Since the sideway trend is a regular phenomenon in Forex and occurs in all the currencies pairs, we recommend learning how to use this trading situation for your benefit.
Forex technical analysis indicators
Forex traders, the proponents of technical analysis, rely on different indicators in their trading practice. Technical analysis indicators can be divided into two categories based on the timing of the signals they provide.
Leading indicators
Leading indicators serve as indicators of future changes in the market and are used to predict price activity. These indicators provide the signals before the prospective reversal happens on the chart. The most significant advantage of leading indicators is that they can inform you beforehand about the upcoming reversal of price movement to plan your trades.
However, leading indicators are not 100% reliable and often give false signals. That’s why Forex traders should combine leading indicators with other technical analysis tools in their daily trading routine.
Some of the most popular leading indicators are the Relative Strength Index (RSI), the Stochastic Oscillator, and the Williams %R.
Lagging indicators
We can call lagging indicators trend confirming because they provide signals right after the event appears on the chart confirming it. This type of indicator has a relatively high signal success rate, but at the same time, based on them, traders enter a trade quite late. That’s why traders tend to miss a relatively large part of the price action.
The most widespread lagging indicators are the Moving Averages (simple, exponential, volume-weighted, displaced, etc.), Parabolic SAR, and the Moving Average Convergence Divergence (MACD).
No indicator can always be accurate. So, it’s a good idea to use confirmation, especially when you enter a trade by a leading indicator signal with a small position and then build it up after a lagging indicator confirms.
Technical analysis chart patterns
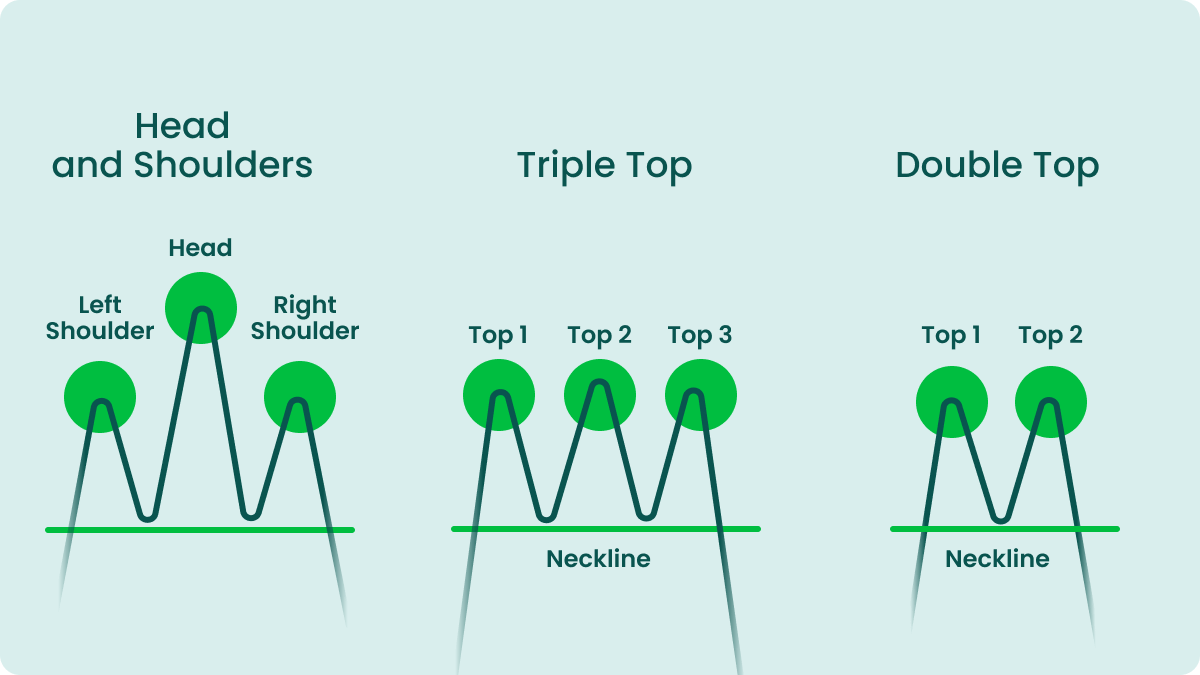
A technical analysis chart pattern is a set of price actions that forms a particular geometric figure on the chart and makes it possible to predict further price movement in the market with high probability. Chart patterns make it easier to trade Forex. They help traders to make reasonable decisions on their trades. The main disadvantage of chart patterns is the subjectivity of their perception. So, on the same chart, a seasoned trader can determine a non-typical pattern and benefit, while a novice trader may find a standard figure and lose.
There are two primary types of chart patterns:
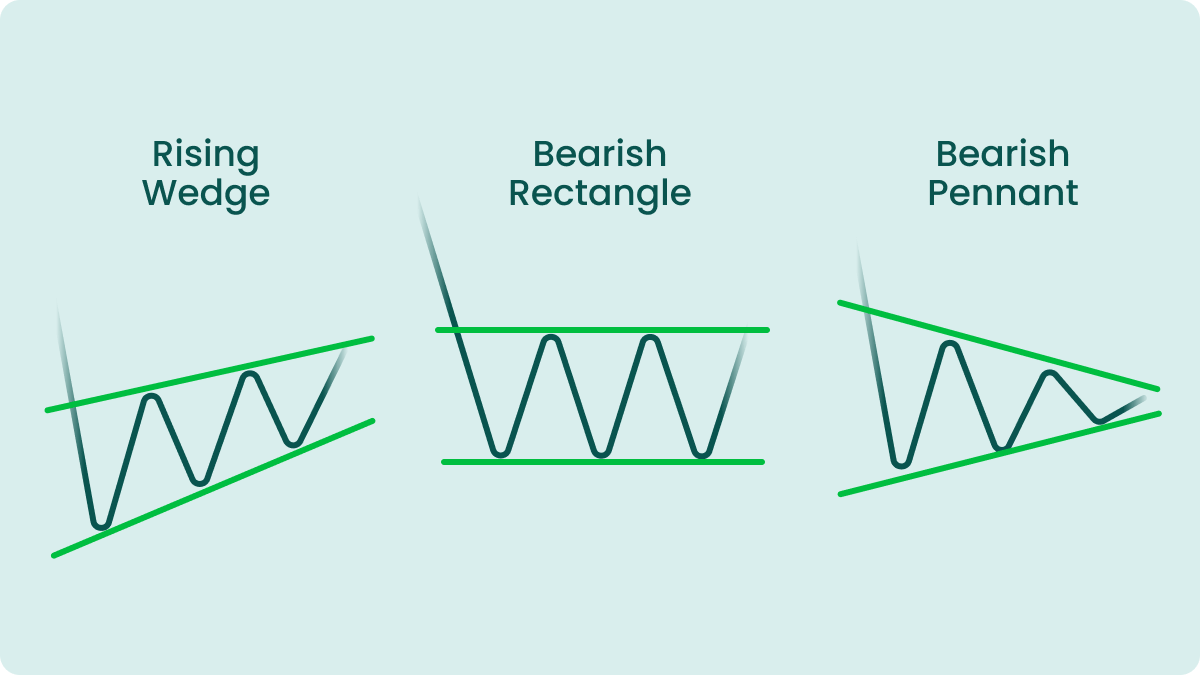
- Reversal patterns. Such chart figures indicate the upcoming change of ongoing market trend. We consider five reliable reversal chart patterns: double top, double bottom, triple bottom, wedges, head and shoulders, symmetrical triangle, and triple top.
- Continuation chart patterns. Type of chart patterns illustrating the future continuation of an ongoing trend. The most popular continuation chart patterns are pennants, flags, rectangles, and wedges (may be either reversal or continuation patterns).
Traders should remember that the Forex market is open around the clock, and one day's closing is usually the next day's opening.
Candlestick patterns
In Forex, a candlestick pattern is an individual candle or formation of multiple candles that illustrate the price movements and give an overview of trading activity. Candlestick patterns are pretty informative, and that’s why they are trendy among Forex traders. Plus, this technical analysis tool is unsophisticated and suitable for novice traders.
There are two main types of candlestick patterns – reversal and continuation.
- Reversal candlestick patterns are the candlesticks placed in such a way as to demonstrate the end of the current trend in favor of another one. Traders can meet different candlestick patterns: hammer, hanging man, engulfing, morning star, shooting star, and evening star.
- Continuation candlestick patterns are candlesticks illustrating that the short-term trend based on some previous candles will move in the same direction. There are some reliable continuation candlestick patterns: deliberation, concealing baby swallow, mat hold, and method.
Candlestick patterns are an essential tool for Forex traders. Technical analysts believe you can learn much from this concise formation to predict future market sentiment and benefit from it.
Conclusion
To sum up, technical analysis in Forex trading is the irreplaceable method of a market examination. The high liquidity in Forex relating to the number of participants, trading volumes, and market sensitivity to different circumstances and tendencies means that Forex is a constantly changing and prone to repetitive patterns market. Forex technical analysis is beneficial for traders to predict the directions of price movements providing the best options for entry and exit from the market. It includes many tools and indicators that open up many opportunities for successful trading.
Our guides and recommendations will help you to learn more about technical analysis and other aspects of trading. Join us and create your trading path with FBS!
FAQ
Do professional traders use technical analysis?
Technical analysis is a method used by both fundamental and technical traders. Yet, sticking to fundamental analysis, many fundamental traders confirm their decisions to enter the trade only after considering chart patterns and other technical analysis tools.
How to learn technical analysis?
- Learn the basic concepts and fundamental tools of technical analysis.
- Put your knowledge into practice in a controlled environment.
- Make real trades.
- Keep improving your knowledge of technical analysis.
What are the types of analysis in Forex?
Typically, the Forex market analysis falls into three types: fundamental, technical, and sentimental.


